ELECTIONS 2024
ELECTIONS 2024
Occupations of party candidates
All 891 candidates for the 2024 elections had to indicate their occupation in their nomination forms. The 377 candidates belonging to a party (i.e. all but independent candidates) listed 158 different occupations were listed, sometimes with variations in names (e.g. Barrister and Barrister-At-Law). The most common occupation is Self Employed with 63 candidates (16.7%) followed distantly by Barristers (and Barristers At Law) with a combined 33 candidates out of 377 (8.8%).
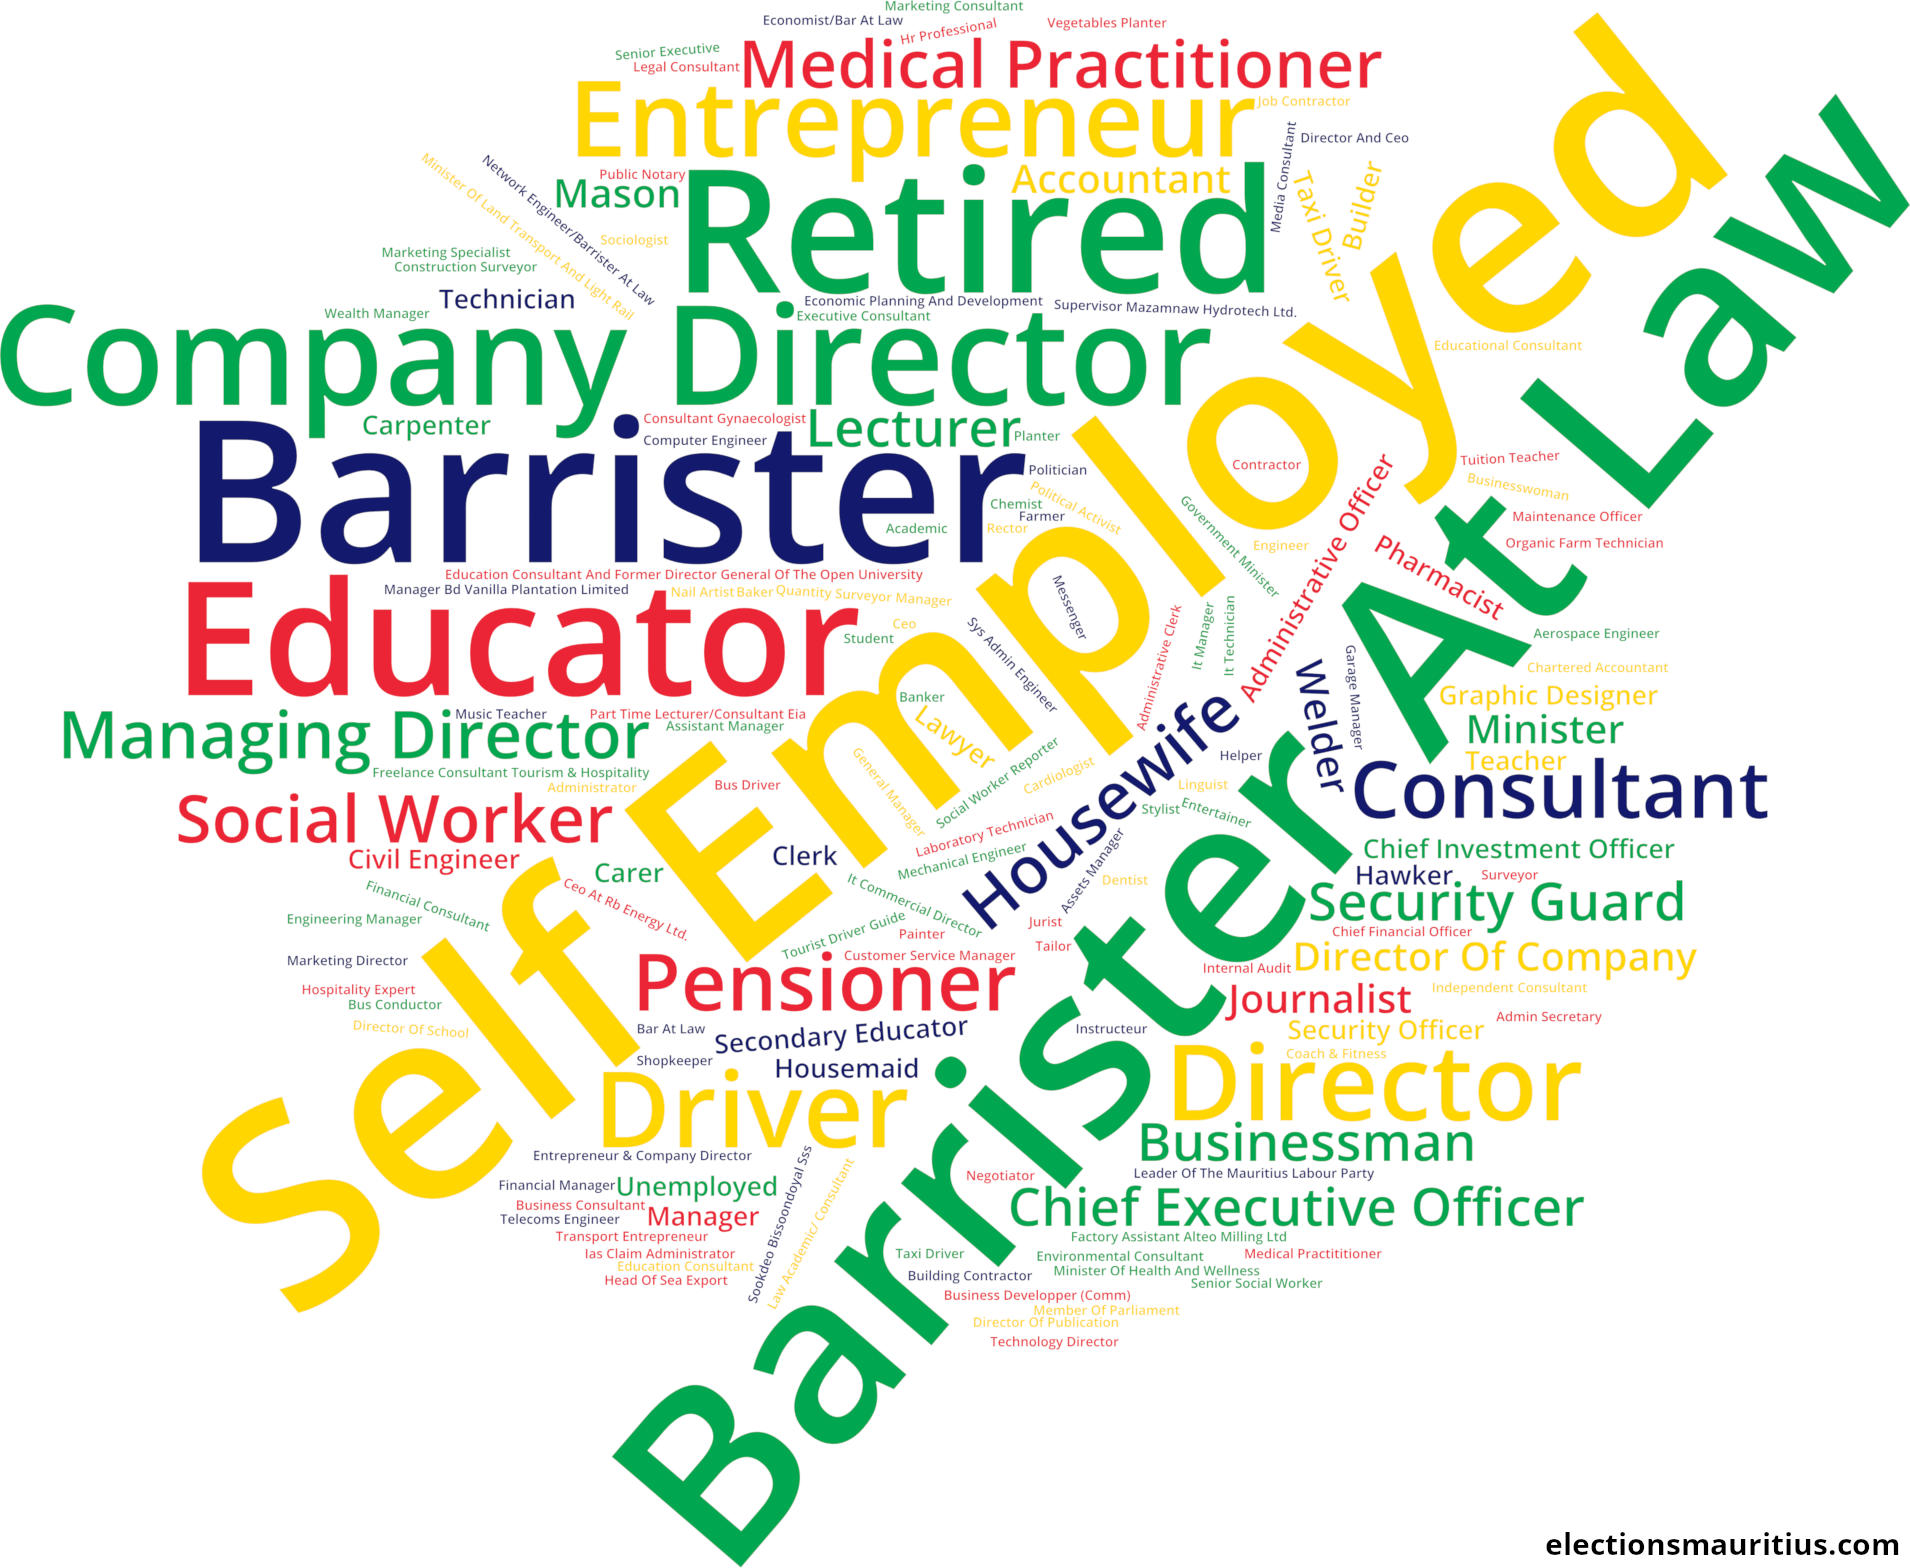
Occupations which have been indicated by at least two candidates sorted by popularity.
| Occupation | Number of candidates | Percentage of candidates |
| Self Employed | 63 | 16.71% |
| Barrister At Law | 18 | 4.77% |
| Barrister | 15 | 3.98% |
| Company Director | 14 | 3.71% |
| Retired | 13 | 3.45% |
| Educator | 12 | 3.18% |
| Director | 8 | 2.12% |
| Driver | 8 | 2.12% |
| Entrepreneur | 8 | 2.12% |
| Consultant | 6 | 1.59% |
| Pensioner | 6 | 1.59% |
| Housewife | 5 | 1.33% |
| Managing Director | 5 | 1.33% |
| Medical Practitioner | 5 | 1.33% |
| Social Worker | 5 | 1.33% |
| Businessman | 4 | 1.06% |
| Chief Executive Officer | 4 | 1.06% |
| Lecturer | 4 | 1.06% |
| Security Guard | 4 | 1.06% |
| Accountant | 3 | 0.80% |
| Director Of Company | 3 | 0.80% |
| Journalist | 3 | 0.80% |
| Mason | 3 | 0.80% |
| Minister | 3 | 0.80% |
| Welder | 3 | 0.80% |
| Administrative Officer | 2 | 0.53% |
| Builder | 2 | 0.53% |
| Carer | 2 | 0.53% |
| Carpenter | 2 | 0.53% |
| Chief Investment Officer | 2 | 0.53% |
| Civil Engineer | 2 | 0.53% |
| Clerk | 2 | 0.53% |
| Graphic Designer | 2 | 0.53% |
| Hawker | 2 | 0.53% |
| Housemaid | 2 | 0.53% |
| Lawyer | 2 | 0.53% |
| Manager | 2 | 0.53% |
| Pharmacist | 2 | 0.53% |
| Secondary Educator | 2 | 0.53% |
| Security Officer | 2 | 0.53% |
| Taxi Driver | 2 | 0.53% |
| Teacher | 2 | 0.53% |
| Technician | 2 | 0.53% |
| Unemployed | 2 | 0.53% |
Totals may not add up to 100% due to rounding.